Data
source https://www.kaggle.com/datasets/kukuroo3/body-performance-data
heres first 10 data point
| age | gender | height_cm | weight_kg | body fat_% | diastolic | systolic | gripForce | sit and bend forward_cm | sit-ups counts | broad jump_cm | class |
|---|---|---|---|---|---|---|---|---|---|---|---|
| 27 | M | 172.3 | 75.24 | 21.3 | 80 | 130 | 54.9 | 18.4 | 60 | 217 | C |
| 25 | M | 165 | 55.8 | 15.7 | 77 | 126 | 36.4 | 16.3 | 53 | 229 | A |
| 31 | M | 179.6 | 78 | 20.1 | 92 | 152 | 44.8 | 12 | 49 | 181 | C |
| 32 | M | 174.5 | 71.1 | 18.4 | 76 | 147 | 41.4 | 15.2 | 53 | 219 | B |
| 28 | M | 173.8 | 67.7 | 17.1 | 70 | 127 | 43.5 | 27.1 | 45 | 217 | B |
| 36 | F | 165.4 | 55.4 | 22 | 64 | 119 | 23.8 | 21 | 27 | 153 | B |
| 42 | F | 164.5 | 63.7 | 32.2 | 72 | 135 | 22.7 | 0.8 | 18 | 146 | D |
| 33 | M | 174.9 | 77.2 | 36.9 | 84 | 137 | 45.9 | 12.3 | 42 | 234 | B |
| 54 | M | 166.8 | 67.5 | 27.6 | 85 | 165 | 40.4 | 18.6 | 34 | 148 | C |
Visualise


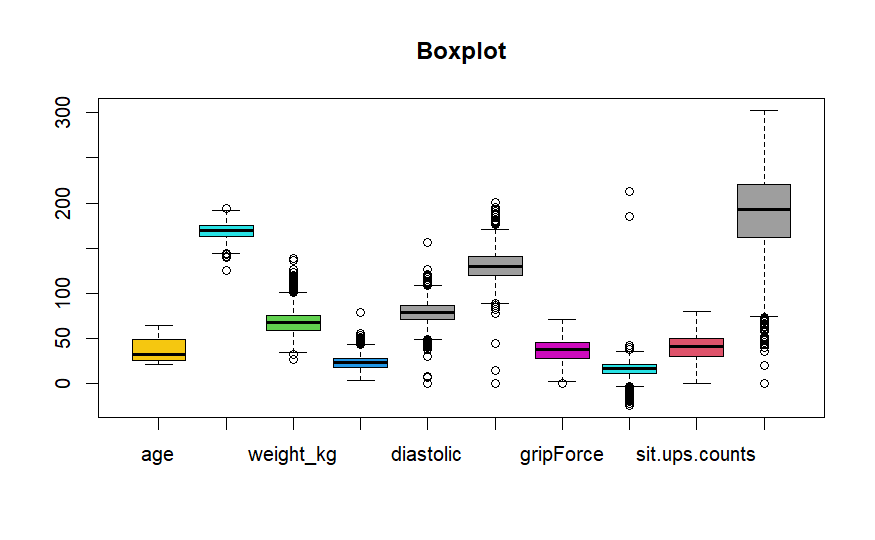
Summary
heres basic summary of the data
| Statistic | age | gender | height_cm | weight_kg | body.fat_ | diastolic | systolic | gripForce | sit.and.bend.forward_cm | sit.ups.counts | broad.jump_cm | class |
|---|---|---|---|---|---|---|---|---|---|---|---|---|
| Min. | 21.00 | Length:13393 | Min. :125.0 | Min. : 26.30 | Min. : 3.00 | Min. : 0.0 | Min. : 0.0 | Min. : 0.00 | Min. :-25.00 | Min. : 0.00 | Min. : 0.0 | Length:13393 |
| 1st Qu. | 25.00 | Class :character | 1st Qu.:162.4 | 1st Qu.: 58.20 | 1st Qu.:18.00 | 1st Qu.: 71.0 | 1st Qu.:120.0 | 1st Qu.:27.50 | 1st Qu.: 10.90 | 1st Qu.:30.00 | 1st Qu.:162.0 | Class :character |
| Median | 32.00 | Mode :character | Median :169.2 | Median : 67.40 | Median :22.80 | Median : 79.0 | Median :130.0 | Median :37.90 | Median : 16.20 | Median :41.00 | Median :193.0 | Mode :character |
| Mean | 36.78 | Mean :168.6 | Mean : 67.45 | Mean :23.24 | Mean : 78.8 | Mean :130.2 | Mean :36.96 | Mean : 15.21 | Mean :39.77 | Mean :190.1 | ||
| 3rd Qu. | 48.00 | 3rd Qu.:174.8 | 3rd Qu.: 75.30 | 3rd Qu.:28.00 | 3rd Qu.: 86.0 | 3rd Qu.:141.0 | 3rd Qu.:45.20 | 3rd Qu.: 20.70 | 3rd Qu.:50.00 | 3rd Qu.:221.0 | ||
| Max. | 64.00 | Max. :193.8 | Max. :138.10 | Max. :78.40 | Max. :156.2 | Max. :201.0 | Max. :70.50 | Max. :213.00 | Max. :80.00 | Max. :303.0 |
check details