
The Binomial distribution is a probability distribution that describes the probability of obtaining exactly k successes in n independent Bernoulli trials (where each trial has only two possible outcomes, usually called “success” and “failure”). It’s defined by the following formula:
\[P(X = k) = \binom{n}{k} p^k (1 - p)^{n-k}\]Where:
- $n$: Number of trials
- $p$: Probability of success in each trial
- $k$: Number of successes
👉 Binomial Distribution Visualization
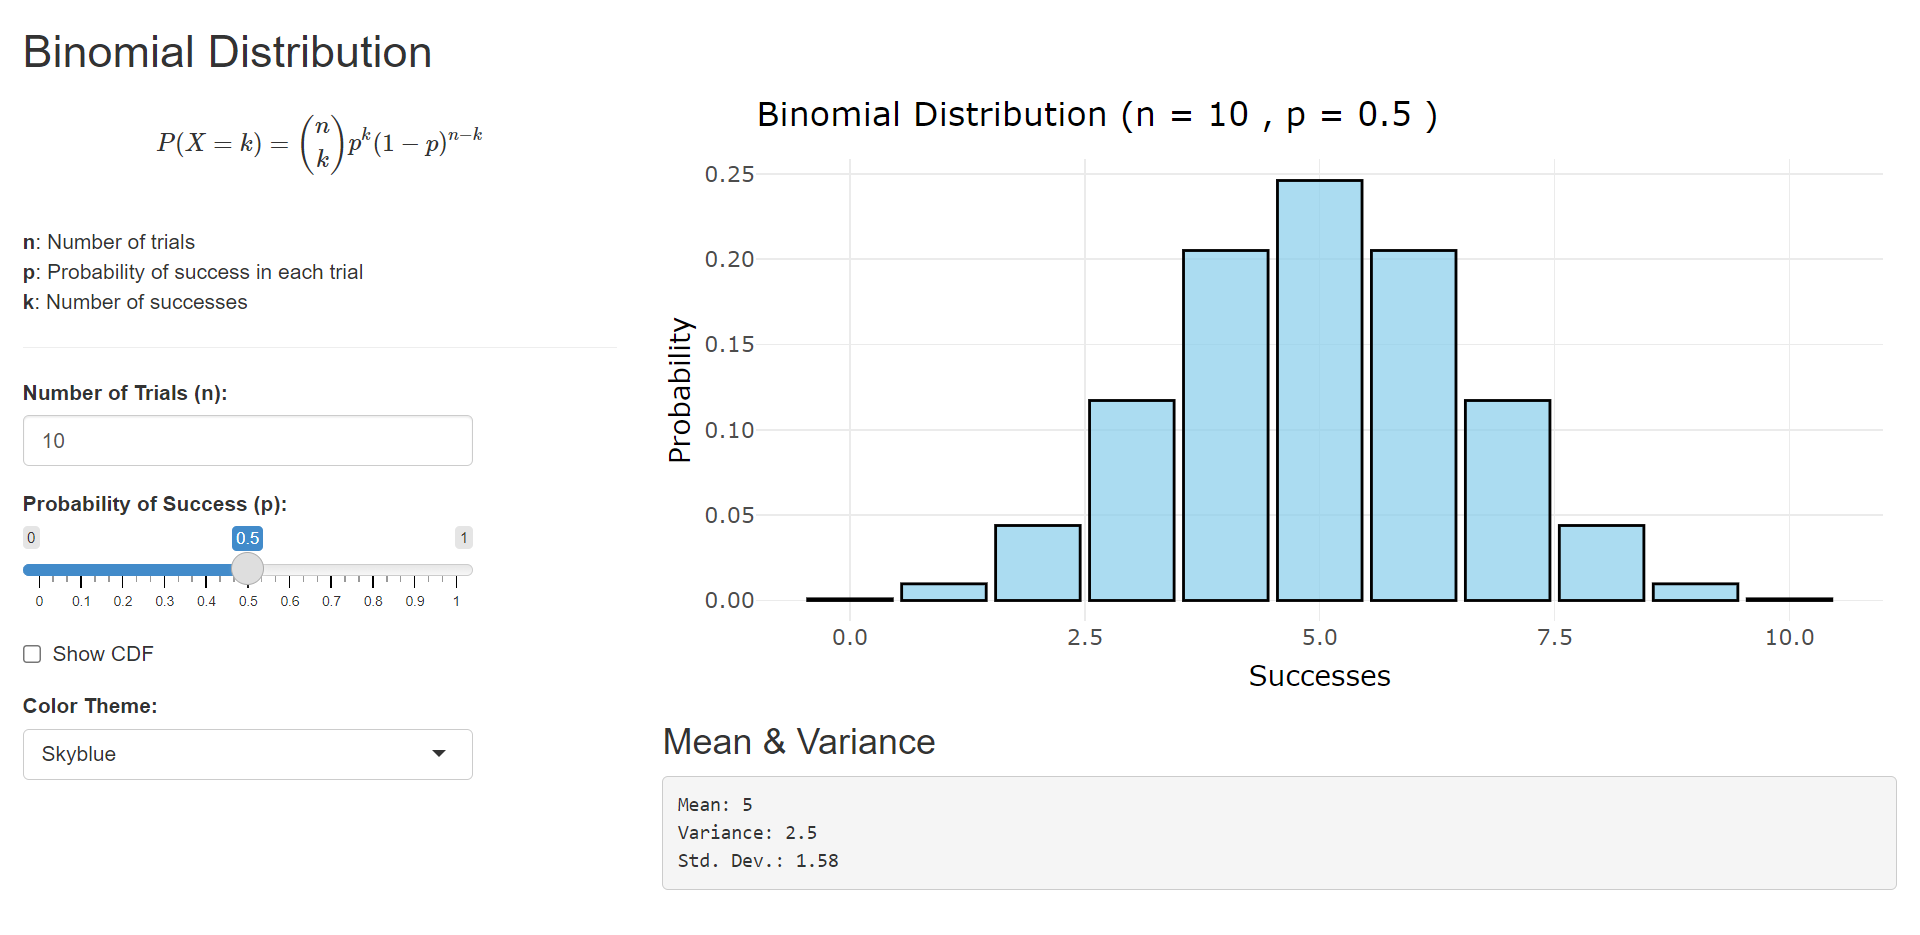
Key Features and How to Use:
The Shiny app provides an intuitive interface for experimenting with the Binomial distribution. You can:
- Adjust n (Number of Trials): See how increasing the number of trials affects the spread and shape of the distribution. Larger values of n generally lead to a wider distribution.
- Adjust p (Probability of Success): Observe how changing the probability of success influences the distribution’s skewness. Values of p closer to 0 or 1 result in skewed distributions, while values closer to 0.5 tend to produce more symmetrical distributions.
- Visualize the Probabilities:The chart dynamically updates to display the probability of each possible outcome (number of successes) for the chosen parameters. The height of each bar represents the probability P(X = k).
- Explore Mean and Variance:This also displays the calculated mean and variance of the distribution, providing further insights into its properties.